Project archive · 2018
Self Drawing Equation
An old high-school project: create a two-dimensional equation whose graph draws the equation itself.
- Mathematics
- Matlab
- Desmos
The project started with two goals: have fun, and create a 2D equation that could draw its own written representation on a Cartesian plane.
The motivating thought was delightfully impractical: if an equation described the whole universe, then a written copy of it would exist inside its own solution. Could a much smaller equation at least draw itself?
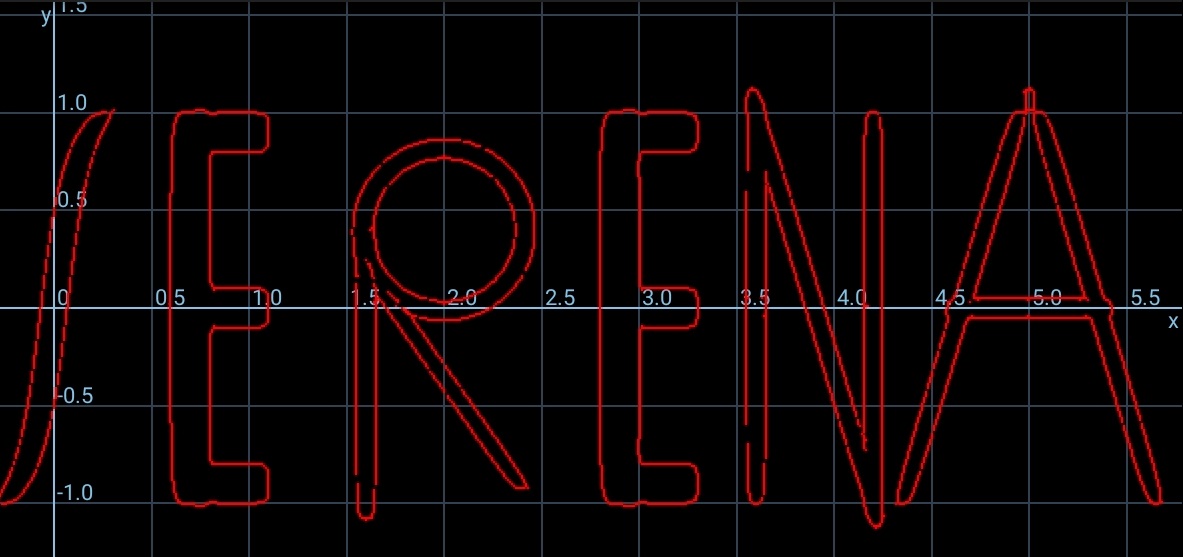
Drawing an alphabet
I first defined equations for every symbol required by the final expression:
0123456789+*-/^=()xyteansigfwhrdlo.b,Each symbol became a small implicit curve. A selector function could then enable the appropriate curve for every encoded character.
Encoding the equation
The expression had to contain both the drawing machinery and its own encoded text. I associated each character with a digit and concatenated those digits into a very large base-38 integer.
A decoder inside the equation extracts the character at each horizontal position. The corresponding curve is enabled and shifted into place, turning one large number back into a line of mathematical text.
Plotting it
A conventional plotter could not handle the resulting expression well. I wrote a Matlab plotter, which was extremely slow but eventually produced part of the equation.
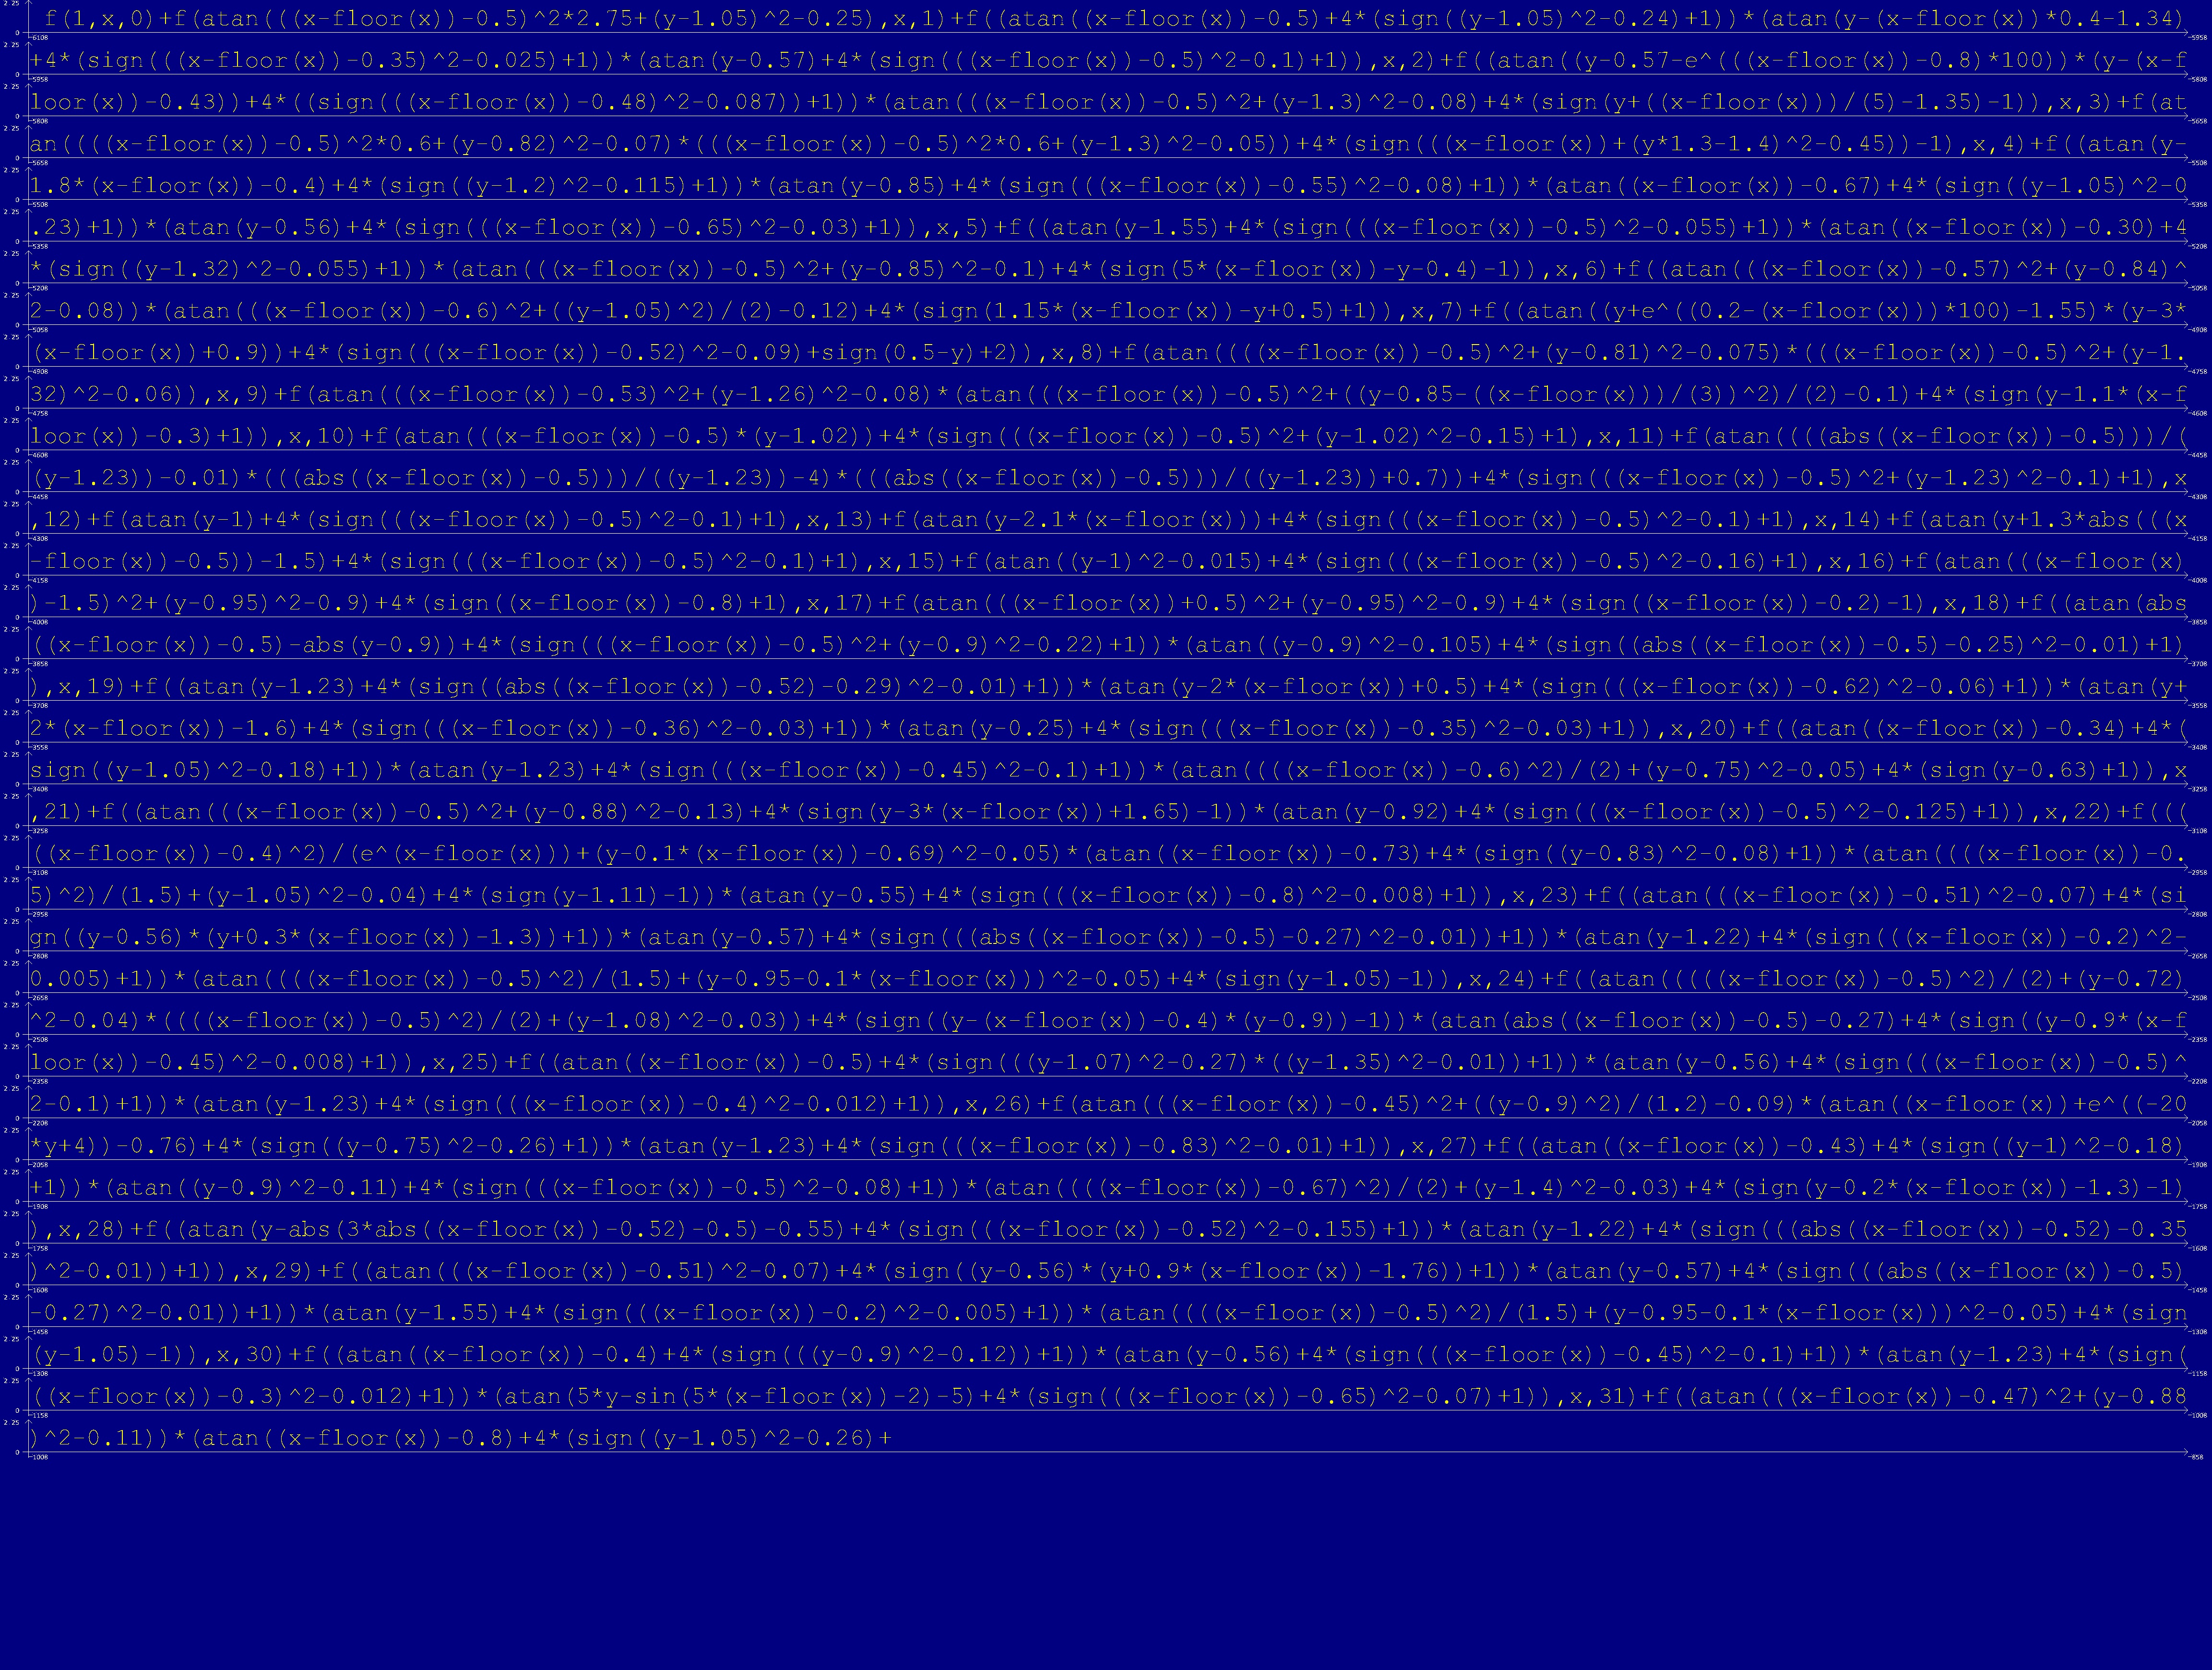
I never completed the full render. Discovering Tupper’s self-referential formula also made my improvised approach feel somewhat less novel, although building it remained worthwhile.
The original source is preserved in this Google Drive folder.
Other equation experiments
I also experimented with implicit equations that create fractal-like structures:
sin(log(((4*x+sqrt(16*x^2-12*(x^2+y^2)))/4)*pi)/log(1.25))
* sin(log(((4*x-sqrt(16*x^2-12*(x^2+y^2)))/4)*pi)/log(1.25)) = 0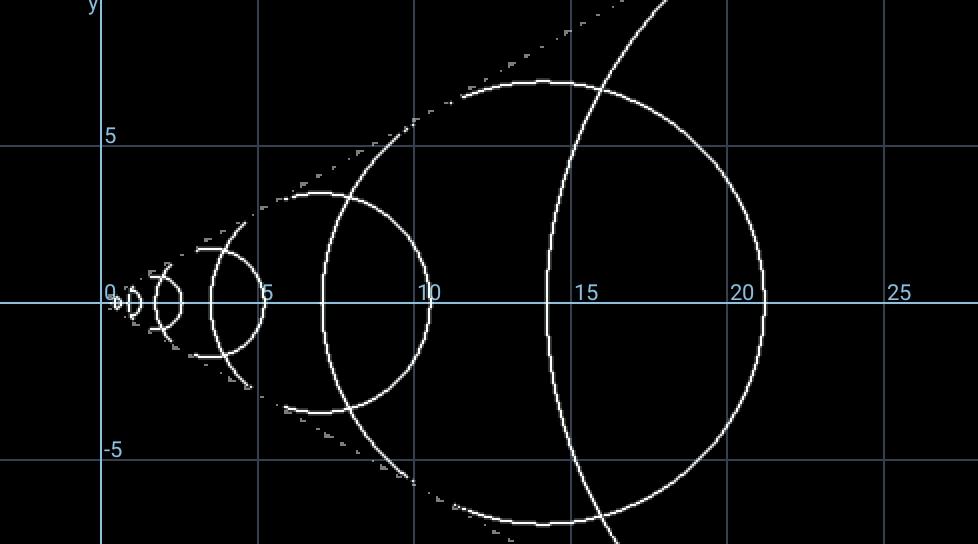
One final equation was made as a birthday present. It may not be mathematically elegant, but it was certainly original.